

- Java and Maven setup
- Some knowledge of Maven and Git
- Working environment with Intellij
- Maven plugin's code, found on Github
In this article, I will be referring to the project you are currently working on as 'your project'. The other project, which contains the Maven plugin's code, will be referred to as the 'Maven plugin's project'.
If you haven't already done it, get the Maven plugin's code by cloning the project on your local machine.
It is important that the plugin's code corresponds to the version configured in your project's pom.xml file. Normally, there should be tags delimiting versions for the project - check the tags available in the Github project, and switch to the one corresponding to your pom.xml's plugin version.
If you cannot find your version, you can stay on the default 'master' or 'main' branch. See the following section for more details.
If you haven't already done it, get the Maven plugin's code by cloning the project on your local machine.

If you have a settings.xml file that doesn't rely on the Maven central repository, backup the file and deactivate it temporarily (by renaming it) before the next step. You might not be able to pull certain libraries if you rely on that settings.xml file.
Execute
so maven archives this SNAPSHOT version in the .m2 folder.
Now, go to your project's pom.xml file, and make sure to specify that the plugin will use the SNAPSHOT version that you just compiled (using the <version> tag) by doing the following:
You can find the version of your plugin in the Maven plugin's project, in the pom.xml file.
Create a 'Remote JVM Debug' configuration for your Maven plugin's project in Intellij. Go to your Run/Debug Configurations screen, and click on the '+' icon. Select that configuration, and modify the port number to what you want (i.e., for this example, 5005).
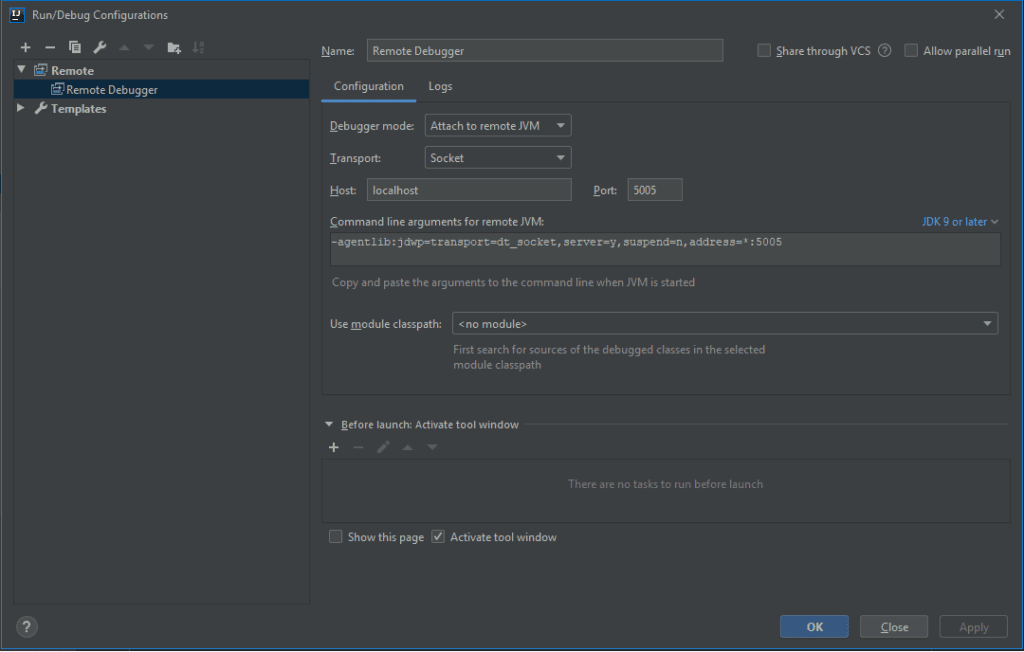
Set the following details:
- Debugger mode: Attach to remote JVM
- Transport: Socket
- Host: localhost
- Command line arguments for remote JVM: -agentlib:jdwp=transport=dt_socket, server=y, suspend=n, address=*:5005
If you try to start your configuration now, it will give you the error :
That is because there has to be a process that wants to connect to that port!
From this point on, have two Intellij windows open: one for your project, and the other for the Maven plugin's project.
Go back to your main project from which you want to debug the maven plugin from.
Go to:
Add the 'command line arguments for remote JVM' mentioned above into the field VM options. (-agentlib:jdwp=…)
Then, do a
(or whatever maven operation that triggers the plugin) to start the maven process. You will notice that it is waiting for activity on port 5005 before continuing its process.
This is when you go back to your Maven plugin project in Intellij (in a different window) and start your 'Remote JVM Debug' configuration with the bug icon.
Now, you'll be able to debug your Maven plugin. Make sure you have put a breakpoint in your Maven plugin code.
In this article, we have gone over how to debug a Maven plugin using Intellij. This required us to create debugging configurations for both your project and the Maven plugin's project to allow them to communicate. Once maven is started on your project, it will wait for the Maven plugin's debugging configuration to start, which will allow you to debug the code.
Happy coding!